
No Facebook page is an isolated island – there’s always other islands nearby, with people coming to and from all of them. And you might think your island is doing well, but how can you really tell if you don’t benchmark your fanpage to nearby islands? Dropping the metaphor, this means that even if you choose your performance indicators precisely for your Facebook page, they’re only truly valid when compared to the results of other pages. Recently, Sotrender went over the crucial indicators that measure your performance. Now it’s time to show you how you can measure them in comparison to others, as well as explain the benefits of such an approach.
Benchmark your fanpage with world’s average
The actual meaning of most of the indicators isn’t apparent until we compare our page to others. Benchmarking on Facebook and comparing your results with the average is the best way to see whether you’re doing well or your activities are useless and time and money-consuming. It’s as sad as it is surprising that Facebook doesn’t provides us with it on a regular basis. You can track your competitors and analyze their results for example in Sotrender. But if you want to check the global average within 5 minutes, use Global Social Facts.
What can you learn from benchmarking?
• Apart from the page size, if your viral reach is more than 65% of your whole reach, try to think about expanding (maybe even promoting content); it would be a pity if you didn’t take advantage of the content that is clearly appealing to people.
• If your paid reach is more than 50% of your reach and your page doesn’t have more than 25 thousands fans, it can be a signal that you’re focusing too much on money.
• If only 1% of your page’s fans is engaged on your page daily, don’t worry! That’s a good result – only 30% of brand pages are that engaging. However, if you’re an admin of a media fanpage, you might want to consider some changes.
How many times have you thought: “20% of our fans were doing something on my page last month, is that good or bad?” Were you wondering whether your paid campaign was too big or too small? Did you want to know how many clicks your page should have in order to be competitive? Unfortunately, there aren’t many places where you can find answers to those questions… Right?
Discover Global Facebook Facts and benchmark your fanpage

Global Social Facts powered by Sotrender
Over the years, Sotrender has gathered over 50 TB of social media data (that is over 65 000 CDs or 2031 BluRay Discs), so we can now compare your Page to others from the same segment (with Facebook Pages that have a size similar to that of your Facebook Page). Connect your account to Global Social Facts and you’ll know what aspects you are doing better than your competition and what you need to improve on.
Benchmark your fanpage to others with Global Social Facts
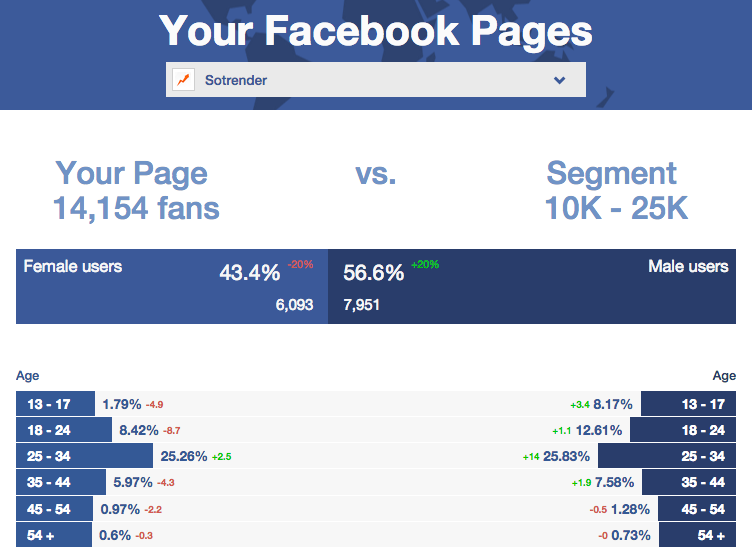
You can check data concerning your demographics and your reach. You’ll find the percentage of activities performed on your page, and how they compare to others in your segment. We also track your engagement, telling you the exact number of different activities that were performed by your fans.
We show you how you’re reaching people, whether through paid, viral, or organic reach. And of course, we compare all of this to benchmarks in your segmented group, allowing you to see how well you’re keeping up with the competition.