Launching Facebook Timeline has made lots of buzz in interactive media. Sotrender analysed how it has really influenced both user and company communication.
Timeline – introduced for all business profiles during March 2012 – is announced to be the biggest change to the b ever. Timeline has brought opportunity to trim up company’s Facebook page and promote the most important content. It is said, that the b for marketers is that “Timeline is a collection of the photos, posts and experiences that help you tell your story.”
Now, when it’s over a month since Timeline has become mandatory for all the companies, Sotrender has decided to check if number of posts per day, percent of engaged users per fanpage, average posts’ lifetime and average number of likes or comments have changed. After analyzing 130 biggest UK company profiles and almost 5 thousand posts there came a conclusion.
None of the following metrics changed significantly in the after-Timeline period:
• page posts per day
• content type distribution
• percent of engaged users per fanpage
• average number of likes, comments and posts per active user
• average response (likes and comments) per post
• cross-page engagement (percent of page’s engaged fans also engaged on other pages)
However, there are two very important changes which cannot be overlooked.
Posts live longer
Sotrender’s study shows that with launching of Timeline average post lifetime is much longer. Before April, by average, users made half of their comments in less than 1 hour. Now, the time in which post gets half the attention and feedback has extended to 2 hours 30 minutes.
What is also important, 80% of all comments are made in circa 8 hours and 30 minutes (2 hours more than before timeline). It’s important information from the marketers’ point of view. If company writes too often, the new posts may cannibalize users engagement of the previous ones.
Bigger engagement
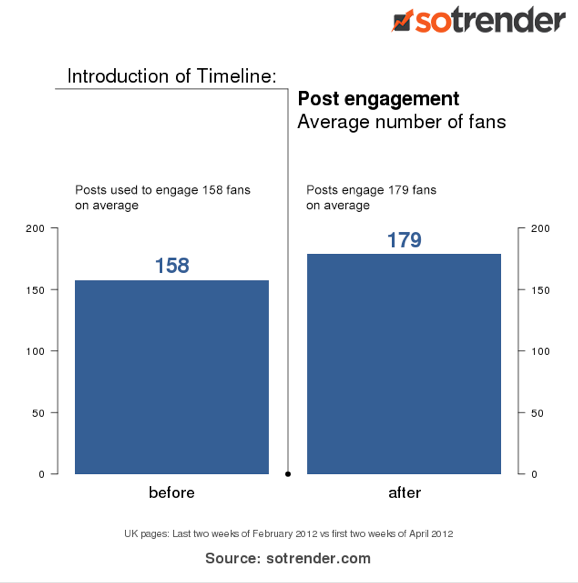
Apart from post lifetime, introducing Timeline helped to exceed 13% growth in the post engagement. Before the Timeline average post triggered the activity of 158 fans. Now it’s 179.
Update: The analysis has just been covered on Read Write Web and The Next Web.
Authors of analysis: Dominik Batorski, PhD (Head of Research), Jacek Szejda (Analyst), Jan Zajac, Ph.D. (CEO), Aleksandra Polak (Analyst)
***
The study reference periods were last two weeks of February and two weeks in April 2012. The Study is based on data gathered and analysed by Sotrender, an online tool for analysis, reporting and optimisation of Facebook marketing activities.


